Geothermal gradient is the rate of increase of temperature with depth. The most accurate values are derived from a series of temperature measurements at different depths, but these data are in the minority. Most geothermal gradients are derived from a single temperature measurement at the bottom of a well. The gradient is then calculated from the difference between the bottom-hole temperature (BHT) and the mean annual surface ground temperature at the well site divided by the depth of the well. The result is most commonly expressed in units of degrees Celsius per kilometer (°C/km) or degrees Fahrenheit per 100 feet (°F/100 ft). 10°C/km = 0.55°F/100 ft.
Geothermal gradient measurements are made at specific locations. Temperatures must vary smoothly, however, so there is an expectation that geothermal gradients will vary smoothly between measurements. Inevitably there are insufficient measurements to characterize all variations and details in temperature and geothermal gradient. Any attempt to draw contours between geothermal gradient measurements is an interpretation. We therefore call the contour map of geothermal gradients an interpretive geothermal gradient map.
Three significant factors should be recognized as interpretive in using a geothermal gradient map. The first is that gradients can change significantly with depth. Heat flow may not be vertical, especially in sedimentary basins with salt domes, but the geothermal gradient is most likely to change vertically with rock type as thermal properties of the rock change. Coal and shale have low thermal conductivity and are associated with high thermal gradients; evaporites (salt and dolomite) have high thermal conductivity and are associated with low thermal gradients. Where these rock types are stacked vertically the geothermal gradient could change by as much as a factor of six. In addition, the mode of heat transfer can change from conduction to convection by groundwater flow. In vertical sections dominated by groundwater flow, the geothermal gradient can drop to zero or even negative. Extrapolation of geothermal gradients to depths greater than the deepest temperature measurement used in the calculation of the geothermal gradient is an interpretation.
The second factor is the depth of measurement. A variety of different data sources have been compiled to contour the maps presented below. Most of these data are bottom-hole temperature data from oil and gas wells.In parts of some basins, such as the Denver Basin the depths of these data may exceed 3 km (9,850 feet). In other basins, such as the Raton Basin, most of the wells are shallower than 1 km (3,300 feet). In the mountain regions of Colorado gradient data are primarily compiled from detailed temperature logs from mineral exploration boreholes. Some of these boreholes exceed 1 km (3,300 feet) in depth, but many are shallower than 500 m (1, 650 feet). Thus, the depth at which the geothermal gradients represent direct measurements varies with the data source.
The third factor is that most of the oil and gas well bottom-hole temperature data are underestimates of the undisturbed rock temperatures. During drilling, one purpose of the circulating drilling mud is to cool the drill bit.The mud also cools the rock.Bottom-hole temperature measurements are generally made before rock at the bottom of the hole has re-heated from cooling by the drilling mud. The precise cooling and recovery time is different in every hole. General cooling corrections have been calculated and these have been applied to the data used in the maps presented below. However, they represent a source of uncertainty in the data.
Funding for this project was provided jointly by the Governor’s Energy Office (contract C900537) and the CGS, whose funding came from the Colorado Department of Natural Resources Severance Tax Operational Fund. Severance taxes are derived from the production of gas, oil, coal, and minerals.
*The Interpretive Geothermal Gradient Map of Colorado includes three map plates, two report documents, a geothermal gradient database, and the native Geographic Information System (GIS) geospatial data files through which the interpretive geothermal gradient maps and projected temperature-at-depth maps. The data are also given as extrapolated temperatures to depth, but heed the cautions given above about the depths of temperature measurements. Geothermal gradient data points for the Interpretive Geothermal Gradient Map of Colorado are shown as black dots. The density of these control (data) points is quite variable. The density of data is highest around Mt Princeton and Hortense Hot Springs, the hottest hot spring system in Colorado and shown enlarged as an inset map on the main map. This high density of data indicates that where very high geothermal gradients are found, they are likely to be very localized. In many other areas of the state, for example the central and western Gunnison valley, there are few or no data. Single high (or low) gradient values may be contoured as broad anomalies such as the large anomaly over Rico in southwestern Colorado. The high geothermal gradients at Rico are real, but the extent of the anomaly shown on the map is questionable. However, no data currently exist to justify drawing it smaller. As we gather more data, we are learning that with “hot spots,” Mt Princeton is the more common size of a geothermal anomaly, not the size indicated for Rico.One area in which the geothermal gradient anomaly does appear to be relatively large in area is the Raton Basin, the southernmost basin in Colorado to the east of the Front Range. New data from this basin indicate that, while not extending quite as far east as shown on the current map, the thermal anomaly covers most of the eastern portion of the basin. Gradients in the basin are generally high, but very slow water flow from west to east appears to be transferring heat from west to east and increasing gradients generally to the east.
The current Interpretive Geothermal Gradient Map of Colorado is a general guide to where geothermal resources are likely to be found in Colorado. As more data are compiled and more is learned about the nature of individual geothermal anomalies, this map will be refined and become more useful at a sub-regional level.
Uses of geothermal resources fall into three general categories, heat pumps, direct use, and electricity generation. The use depends primarily on the temperature of the resource, but also to some extent on the need of the user.
Direct use is any application of heat from the Earth at, or below, the temperature that it comes from the ground (excluding heat pumps). Historically, direct-use applications have used hot water from natural hot springs, artesian (naturally flowing) or pumped wells to transfer the heat to the surface. Since the 1970’s, however, especially in Germany, natural hot water in the subsurface has been more aggressively exploited for direct use by drilling pairs of wells into aquifers with hot water. Water is pumped from the well and returned to the aquifer in the second well [1]. The distance between the wells is sufficient that the reinjected water is reheated before reaching the extraction well. At the surface the water passes through a heat exchanger. Surface water heated in the heat exchanger is used for district heating systems and other direct uses. In Colorado, at present, direct-use applications are restricted to sites where hot water flows naturally to the surface, and a few hot well sites. As demonstrated in Germany, there is much more hot water available for direct use than that at the surface. In Germany this subsurface hot water has been exploited as a pollution-free, sustainable resource.
For electricity generation, water must be hot enough to produce a vapor phase to turn a turbine to drive a generator. Prior to about 1980, the vapor was either natural steam or steam produced by flashing hot water to steam at the surface. A hot water temperature of about 175°C (350°F) or higher was required for efficient electricity generation. In 1981, the first commercially successful binary power plant was introduced into the US, which allowed power production with lower temperature resources. Binary technology uses a secondary working fluid with a boiling point lower than that of water. Currently the lowest temperature at which a binary power plant operates is about 75°C (165°F) and is in Chena, Alaska [2]. Older power plants running on natural or flashed steam may have a small component of pollution, especially if the resource is associated with young volcanic activity. Volcanic gasses, such as carbon dioxide, sulfur dioxide, and hydrogen sulfide may be brought to the surface with the geothermal fluid and released to the atmosphere. With newer binary power plants, however, the geothermal fluid is passed through a heat exchanger and reinjected with no exposure to the atmosphere, and no pollution. Binary power plants produce clean, renewable, baseload, sustainable electrical energy.
Heat pumps are typically the lowest temperature use and do not formally require a geothermal resource. The ground is used as a storage reservoir for heat. In summer, heat is pumped out of a building to cool the structure and the ground is used to absorb the heat. In winter, heat is pumped out of the ground and into the building to heat the structure. Electricity is used to operate the heat pumps, but in terms of heating or cooling a building, a heat pump transferring heat into and out of the ground is a much more efficient use of electricity than using the electricity directly to produce heat. Heat pumps can contribute significantly to a clean energy economy by saving a very substantial fraction of total energy use, although they are not usually included in discussions of alternative energy, unfortunately.
[1] Schellschmidt, R.,Sanner, B.,Pester, S. and Schulz, R., 2010, Geothermal Energy Use in Germany, Proceedings World Geothermal Congress 2010, Bali, Indonesia, 25-29 April, 2010, pp. 1-19.
[2] Chena Hot Springs Resort, Geothermal Power: https://chenahotsprings.com/renewables/
Direct Use
Applications that use heat from the Earth without any temperature or energy form conversion are classified as direct use. Temperatures for direct use applications overlap with ground-source heat pump operating temperatures at the low end to electricity generating temperatures at the high end. Examples of direct uses at different temperatures are shown in the diagram below.
Direct use is generally the most efficient use of a geothermal resource as no energy is lost in energy conversion: heat from the ground is used as heat in the application. However, geothermal heat cannot be transported and must be used close to its source. Insulated pipes can convey hot water for a few miles with only a degree or so loss in temperature, but unless the temperature is high and the flow is large, the cost of pipes quickly overcomes the economics of transporting the resource.
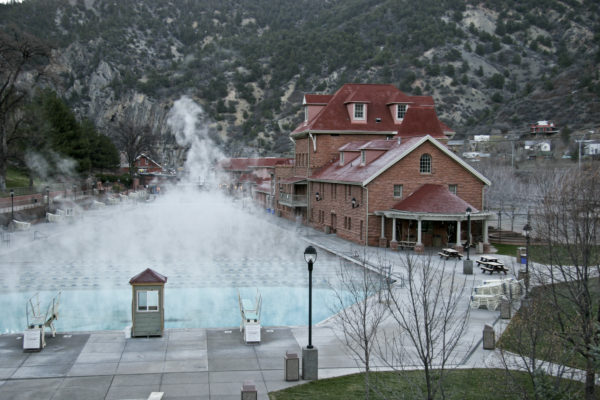
Common direct uses include space heating and the provision of domestic hot water on an individual or community scale, such as in Pagosa Springs. Heated swimming pools and spas are popular if demand is sufficient, such as at Glenwood Springs. More commercial direct uses can be very profitable, but, because the resource must be used where it is found generally require more planning. Geothermal resources are used at a number of sites in Colorado for heating greenhouses and a one site for aquaculture. Finding a market for the produce from these ventures is an essential component of their development.
Many of the potential direct uses of geothermal resources have not been realized in Colorado because users and resources have not yet come together, and there has been no exploitation to date of subsurface hot aquifers as has happened, for example, in Germany. If energy prices continue to rise, direct use of geothermal resources could provide an economical, clean, renewable source of low-grade thermal energy.
Electrical Generation
Historically, Colorado has been considered to have geothermal resources suitable only for direct-use applications. Until very recently, Colorado’s geothermal potential for generating electricity has been assigned little promise. This appears to be based more on a lack of study, rather than on sound science.
Colorado has the second largest heat flow anomaly in North America, as shown on the Geothermal Map of North America. Moreover, drilling by AMAX at Mt. Princeton shows heat-flow values that are substantially higher than the published values. Several of the state’s oil and gas basins reveal formation temperatures above 100°C (212°F) at relatively shallow depths. Indeed, 20 wells in the San Juan Basin have temperatures of 121°C (250°F) or more between 7,000-9,000 feet deep. One well has a temperature of 150°C (302°F) at a depth of only 7,400 feet.
The Western Governors’ Geothermal Task Force identified Colorado as having the potential for 20MW of power generation within a decade. The state is in the process of updating our geothermal database and evaluating this potential energy source, in response to Colorado’s renewable energy portfolio standard for utilities.
The 2008 MIT report on the potential for Enhanced Geothermal Systems (EGS) showed Colorado as the number-one-ranked state in the nation for potential commercial development of this, as yet unproven, resource.
Geothermal resources are in the form of thermal energy and find extensive applications directly in this form. However, to transport the energy away from its source, the energy must be converted into a more portable form, electricity. Electricity is usually generated by using mechanical energy to cause a coil to rotate in a magnetic field. The thermal energy must first then be converted into mechanical energy. As with most conventional generating systems, heat is used to make “steam,” which drives a turbine, which in turn rotates a generator.
Steam can be generated directly from the resource if the resource is sufficiently hot, as shown below. These systems typically require temperatures in excess of 175°C (350°F). Most resources at these temperatures are associated with young volcanic systems and the geothermal fluids can include undesirable gases, such as carbon dioxide, hydrogen sulfide, and sulfur dioxide. Often these gases already leak to the surface through volcanic fissures and vents. Geothermal development may increase their release if the geothermal fluids are exposed to the atmosphere. Pollution control techniques can control the release of these gases.
For lower temperatures (below about 175°C, 350°F), geothermal heat is used to vaporize a fluid with a lower boiling temperature than water. Vapor (“steam”) from this secondary, or working fluid is used to drive a turbine and rotate a generator. These systems are called binary systems and their basic components are shown below. The geothermal fluid (water or brine) is pumped to the surface, through a heat exchanger and returned to its original reservoir through a reinjection well. Heat is transferred to the secondary working fluid in the heat exchanger. Vaporized working fluid droves a turbine, is cooled, and then pumped back through the heat exchanger. In addition to being able to operate with lower temperature resources, an advantage of the binary system is that the geothermal fluid is contained in a closed system and is not exposed to the atmosphere. It remains under pressure which prevents boiling and release of gases. Pollution is eliminated and scaling (deposition if dissolved minerals in the pipes) is significantly reduced. The working fluid is also contained in a closed loop, isolated from the geothermal fluid, and there is no release of fluid from this part of the system.
The efficiency of a turbine driven by a condensing fluid depends on the difference in temperature of the vapor entering the turbine and the temperature on the outflow side of the turbine. Thus, not only is the temperature of the geothermal fluid important, but efficient cooling of the fluid after it passes through the turbine is important. The most effective cooling system for a large flow of fluid is evaporative cooling. This system either directly mixes a relatively small volume of cold water with the geothermal fluid or sprays cold water onto pipes filled with the hot geothermal fluid. Some cooling occurs by heating the cold water, but primary cooling occurs by evaporation of the water (latent heat of vaporization). The evaporation is usually contained in a very large concrete cylinder, gently tapered toward the top and open at the bottom so that the heat and water vapor rises creating an updraft through the cylinder causing further cooling by the updraft of air. These concrete cylinders are the familiar white tower that discharge white clouds of steam associated with most conventional power plants.
For less demanding cooling needs, and where water is not available for evaporative cooling, the geothermal fluid may be cooled by air. Air is forced through coils or radiators through which the fluid from the turbine is circulated by large fans. One or more fans per megawatt of electricity generated are required and the fans must be placed so that there is an unrestricted flow of air into and out or the fans. For larger systems they are commonly placed horizontally about 7.5 m (25 feet) above ground level). Advantages of air cooling include a low profile compared with evaporative cooling towers and no water use or plumes of steam rising above the cooling system. Disadvantages include noise, variable cooling temperature, and a relatively large footprint. Large fans beat the air as they rotate. The maximum noise is emitted in the direction that the fan blows, which is generally up. By erecting sound barriers the noise from the fans can be mitigated. The cooling temperature of air cooling is strongly coupled to air temperature and varies throughout the day and throughout the seasons. Thus, the efficiency of an air-cooled power plant fluctuates down and up as the air temperature rises and falls, respectively.
The image to the right shows the Soda Lake II binary geothermal power plant in Nevada. There is a man in the center right of the image for scale. In the center of the image are two binary power plants, each capable of generating six and a half megawatts of power. Visible equipment includes heat exchangers, turbines, and generators. The only large part of the system is the air cooling which is mounted on the elevated platform above and just behind the generating units. Each short cylinder on the platform contains a cooling fan, and these extend off the image to the left and right. The power plant is still small, but it would be a fraction the size without the air cooling fans.
Where water is relatively abundant, but may not be consumed, jacketed water cooling may be used. This system has only been deployed in very small systems at present, but could be scaled up to much larger systems if sufficient water flows were available. To an everyday analogy, air cooling is like most motorcycle engines where air flows past the cylinder head to cool the engine. Jacketed water cooling is like most automobile engines which have a jacket around the cylinder head through which the engine coolant is circulated to cool the engine and the coolant removes the heat to be lost elsewhere (the radiator). Jacketed water cooling cools the fluid from the turbine by removing the heat with liquid water in a jacket or heat exchanger, keeping the cooling water separated from the working fluid. In a binary power plant the working fluid is then recirculated for reheating. The warmed cooling water is usually reinjected back into the ground and replaced with new cooling water. The advantages of this system are that it is relatively quiet, small, and maintains a very low, constant temperature on the outflow side of the turbine. The only disadvantage is that it requires a large volume of cooling water: the volume of cooling water is approximately equal to the volume of geothermal fluid pumped from the production well(s). However, the use is non-consumptive and non-polluting water use, and the warmed water is immediately replaced into the ground. The only consideration is the change in temperature of the water.
Geothermal resources and the nature of their locations vary considerably and geothermal power plants are generally custom built to meet their specific needs. Combinations of the technologies described above may be used in a single power plant. Compared with other conventional and alternative power generative technologies, when fuel requirements, access roads, and other requirements are considered over a 30–year period, geothermal power plants are considered to have the smallest footprint of any method of power generation per megawatt-hour of power generated. They also have the best record of power availability (capacity factor), with most power plants generating more than 95% of the time.
Geothermal electricity has been produced in the US for more than 50 years without government subsidies at economically competitive process. Geothermal power is a clean, environmentally-friendly, sustainable form of alternative energy.
Enhanced Geothermal Systems
Introduction
There are two requirements for use of a geothermal resource: temperature and a fluid to transport the heat in the resource to the surface. For Ground-Source or Geo-exchange Heat Pumps, the fluid is usually pumped from the surface into the ground (see Heat Pumps), although groundwater may be used as the heat exchange fluid. For Direct Use or Electricity Generation, ground water either rises to the surface naturally or is pumped to the surface to transport the heat to the surface. However, in most areas, temperatures within a few miles of the surface are sufficient for direct use or electricity generation, but there is insufficient ground water to transport the heat to the surface. In these areas heat transport may be increased by the creation of an Engineered or Enhanced Geothermal System (EGS).
In areas where there is insufficient groundwater to transport heat to the surface, the problem is typically not a lack of water, but a lack of interconnected pathways, or permeability, through which the water may flow. There are two approaches to solving this problem: 1) increase the permeability of the rocks; and 2) place a heat exchanger in the ground in a borehole with the heat-transporting fluid circulating inside the heat exchanger.
The second option is the most common method of heat exchange used with heat pumps, but is also used in some direct use applications. It has the advantage that fresh water may be used in the heat exchanger and the same fresh water used in the direct-use application, such as aquaculture or bathing. The first option is EGS and is the most common option tested to date for electricity generation. A number of attempts have been made around the world to establish flow between two boreholes through a series of artificially induced fractures. The ability to create a circulation system with both high productivity and constant high temperatures has not yet been demonstrated.
Diagram of the EGS Concept (from DOE, 2008, Figure 2)
Los Alamos Hot Dry Rock Experiment
The first enhanced geothermal system experiment (formerly known as the Hot Dry Rock Experiment) was carried out under the leadership of the Los Alamos National Laboratory in northern New Mexico about 30 km (19 miles) west of the Laboratory. Their model was that crystalline basement rock was impermeable to water: if fractures could be created in this rock then a closed loop flow of water could be produced in this rock (where the rock was hot) to extract heat from the Earth.
During Phase I of the project two holes were drilled to a depth of about 3 km (6,560 feet) and a temperature of about 200°C (392°F). Fractures were generated at the bottom of the two holes by hydraulic fracturing. This process is a standard practice in oil and gas wells to increase productivity. The process involves pumping water down the wells, with only a short section of the well open to rock, until the pressure causes natural fractures in the rock to open or new fractures to be generated. The initial hydraulic fracturing by Los Alamos created a poor connection between the two wells. After additional experimentation, redrilling of one of the wells, and additional hydraulic fracturing, a fracture area of approximately 50,000 square meters (540,000 square feet) was produced with relatively good connection between the wells. Water was circulated between the wells through the fracture system in a closed, recirculating, pressurized water loop and heat extracted from the subsurface at rates of up to five megawatts of thermal energy.
Phase II of the project attempted to establish a connection between two wells at a depth of about 4.5 km (14,765 feet) at a temperature of about 300°C (570°F) using the experience gained in Phase I of the project. A fracture system was again created by hydraulic fracturing with an estimated area of 1,500,000 square meters (16,145,000 square feet). As with Phase I, the initial connection between the two Phase II wells were poor, but despite many attempts to improve the connection, including chemical leaching of the fractures to decrease their resistance to flow, a high-flow connection between the two Phase II was never achieved.
The Los Alamos experiment has become the model for most subsequent, enhanced geothermal-system projects. Typically a hole is drilled down to crystalline basement rock to a depth where the temperature is hot enough for heat extraction. Fractures are created, generally by hydraulic fracturing. A second hole is drilled to intersect the fractures and create a loop through which water may be circulated. These projects in England, Japan, Germany, France, Australia, and other states in the US have resulted in significant improvements in the understanding and technology of fracturing crystalline rock at relatively high temperatures. However, the systems are far below the threshold for the economic generation of electricity. Each project has faced one or more of the following problems: high costs; difficulty in establishing connection through fractures; uneconomically low flow; relatively rapid decrease in temperature; significant (>10%) loss of water in circulation.
Colorado’s EGS Ranking
Colorado has been ranked as having the highest EGS geothermal resource of all 50 states in the 3 to 4 km (9,850 to 13,125 ft) depth range (Tester et al., 2006). The technology is not ready to economically extract this heat. A modification of the crystalline rock, EGS technique may be closer to production. Colorado has a number of deep sedimentary basins and the temperatures in the deep portions of some of these basins exceed 150°C (300°F). Oil and gas companies have decades of experience in hydraulic fracturing of sedimentary rocks and at working at these temperatures. Electricity can be generated at these temperatures. During the next few years, the Raton Basin is likely to be drilled to a depth of about 3 km (9,850 ft) with the goal of developing a sedimentary rock enhanced geothermal system. This project will not require any experimental technology. The only unknown is how well heat can be extracted from these formations. If this project is successful, large areas of the sedimentary basins of Colorado will become prospective sedimentary EGS sites.
DOE, 2008, An Evaluation of Enhanced Geothermal Systems Technology, U. S. Department of Energy.
Tester et al., 2006, The Future of Geothermal Energy: Impact of Enhanced Geothermal Systems (EGS) on the United States in the 21st Century, Massachusetts Institute of Technology.
Heat Pumps
These heat pumps are used to supplement heating and air conditioning systems in buildings, both large and small. They only require an ambient ground temperature of around 55F rather than higher temperatures. They are perhaps the most under-appreciated energy-saving devices known.
They are variously known as geothermal heat pumps, geoexchange heat pumps, ground source heat pumps, and geosource heat pumps. Delta-Montrose Rural Electric Association is a leader in promoting the installation of these systems in Colorado. Although it is best to install the systems when a house is being built, a great advantage is that existing houses and buildings can be retrofitted with these systems.
Retrofitting the Governor’s Mansion with a geoexchange system lowered energy consumption by 70%. This success led to geoexchange being incorporated into the renovation of the Capitol. Users not only like the lower costs, but assert that it creates a more comfortable and enjoyable environment in their homes.
Heat pumps are systems that transfer heat and can transfer heat in the opposite direction to the temperature gradient, that is from a colder temperature to a hotter temperature. A common example of heat pump use is a refrigerator: heat is transferred from the freezer to the outside of the refrigerator, typically coils on the back or the underside.
Most building heat pumps are reversible and can operate in either direction. In summer they transfer heat out of the building. In winter they transfer heat into the building. Air-source heat pumps exchange heat on the outside with the air. This transfer is not very efficient because air has a low density and varies considerably in temperature throughout the day and throughout the year. A more efficient heat exchange medium is the ground. A few feet below the surface the daily and annual temperature changes are very small and earth materials have good thermal properties for heat exchange. In the 1970’s heat pumps that exchange heat with the ground were called geothermal heat pumps. This name has been abandoned, however, as it implies that the heat pumps use the heat of the earth. The heat pumps only use the ground as a medium for exchanging heat: in winter they take heat from the ground; in summer they transfer heat into the ground. These heat pumps are now most commonly known as ground-source heat pumps, or geoexchange heat pumps.
Heat transfer with the ground occurs in loops of pipe through which fluid circulates. The fluid is usually water mixed with antifreeze to prevent freezing. The size of the loop is calculated on the basis of the heat exchange needs of the building: a small house typically requires one 300-foot loop; a very large house might require four or more loops. If adequate ground area is available, the loops are installed horizontally in 4- to 6-foot deep tranches. Without adequate ground area, the loops are installed in vertical boreholes. For efficient heat transfer the ground loops should have good thermal contact with the ground and should be thermally grouted. Heat transfer is most effective when the loop is placed below the water table or in wet or saturated ground.

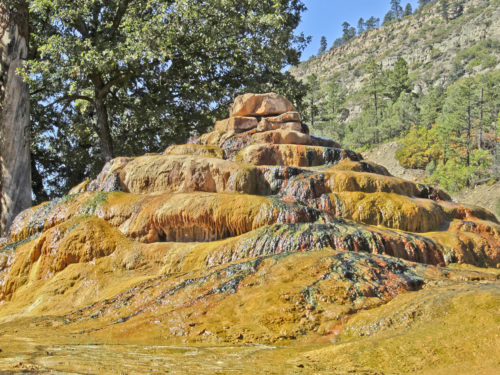
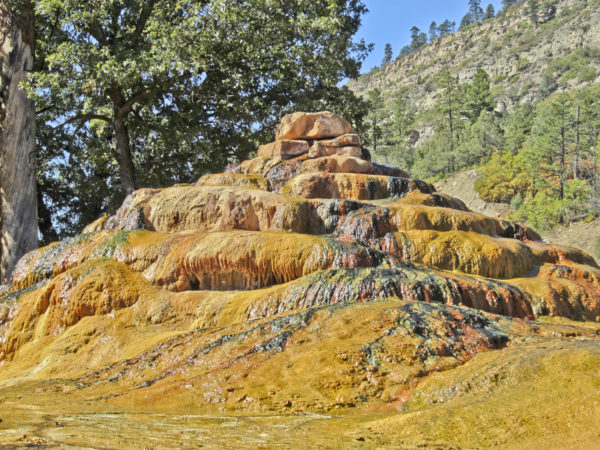
![Hortense Hot Springs well house, Chaffee County, Colorado, [1990?]. Photo credit: CGS.](https://coloradogeologicalsurvey.org/wp-content/uploads/E-462-hortense-600x410.jpg)
